Video Marketing Statistics: 2026 Data + 32 Historical Benchmarks

Co-founder of Yum Yum Videos | Explainer Video & Video Marketing Expert

Video marketing statistics are useful when you know what year they came from. A current benchmark can help with planning. An older benchmark can show how the market evolved, and some older numbers continue to attract citations years after they were first published.
This article does both. First, I added a short 2026 snapshot using current data from Wistia and YouTube. Then I preserved the 32 historical video marketing statistics that have been part of this page for years. I did not rewrite their numbers into newer claims because several are legacy benchmarks that have been cited externally.
At Yum Yum Videos, an animated explainer video company, we have produced more than 1,000 videos since 2012. The most useful way to read statistics like these is to separate market benchmarks from your own video marketing analytics. Benchmarks tell you what has happened elsewhere. Your own watch time, conversions, pipeline, sales, and support data tell you what video is doing for your business.
For the planning side, see our video marketing strategy guide. For current format and platform changes, see the latest video marketing trends.
Table of Contents
TL;DR: Video Marketing Statistics for 2026
- Wistia analyzed more than 13 million videos and 79 million hours of viewing data for its 2026 State of Video report.
- Wistia found that 76% of companies make at least one video per month.
- Eight in ten teams in Wistia’s survey said LinkedIn is their primary place to share B2B video.
- More than one third of teams already use AI in their video workflow, most often during preproduction.
- YouTube says Shorts now averages 200 billion daily views.
Current Video Marketing Statistics for 2026
1. 76% of Companies Produce at Least One Video a Month
Wistia’s 2026 State of Video report surveyed more than 900 professionals and analyzed more than 13 million videos. It found that 76% of companies produce at least one video per month. That is a useful current benchmark for production cadence because it comes from a large video specific dataset.
Source: Wistia 2026 State of Video
2. LinkedIn Is the Primary B2B Video Channel for 8 in 10 Teams
For B2B video marketing statistics, one of the clearest 2026 changes is LinkedIn. Wistia reports that 8 in 10 teams use LinkedIn as their primary place to share video, ahead of YouTube in its survey.
This does not mean every B2B company should move its entire video strategy to LinkedIn. It does mean native product clips, customer stories, expert commentary, and event excerpts deserve a place in the channel plan.
Source: Wistia 2026 State of Video
3. More Than One Third of Teams Already Use AI in Video Workflows
Wistia found that more than one third of teams already use AI in their video workflow, most commonly during preproduction. Research, first pass scripting, captioning, transcript cleanup, rough edits, and localization are practical uses. The final creative decisions still need a clear audience and a reason for the video to exist.
Source: Wistia 2026 State of Video
4. YouTube Shorts Averages 200 Billion Daily Views
YouTube says Shorts now averages 200 billion daily views. That makes short form one of the largest discovery surfaces in video, especially when a short clip points toward a deeper tutorial, product page, webinar, or longer video.
Source: YouTube 2026 CEO letter
5. YouTube Has Led U.S. Streaming Watch Time for Nearly Three Years
YouTube also reports that it has ranked first in U.S. streaming watch time for nearly three years, citing Nielsen. This matters because video is increasingly watched across phones, computers, and television screens, with no single device category defining the experience.
Source: YouTube 2026 CEO letter
How to Use Video Marketing Analytics With Industry Benchmarks
Industry statistics are context. Video marketing analytics should determine what you change next.
| Goal | Useful analytics |
|---|---|
| Awareness | Qualified reach, watch time, branded search, site visits |
| Engagement | Retention, completion, clicks, page behavior |
| Lead generation | Forms, demos, trials, qualified pipeline |
| Sales support | Opportunity movement, close rate, sales cycle length |
| Customer education | Activation, adoption, support tickets, completion |
If you need to connect those outcomes to money, our guide to video marketing ROI explains attribution, cost, and return in more detail.
32 Historical Video Marketing Statistics and Benchmarks
Important source note: the 32 statistics below are preserved from earlier versions of this article because they are part of the page’s citation history. They are historical benchmarks. I am not presenting every number as a description of the 2026 market. Where the original article cited a source, I kept that source. Where no traceable source was attached, I label the number as a legacy benchmark instead of presenting it as current research.
1. A Minute of Video Is Worth 1.8 Million Words
The original article cited Forrester researcher Dr. James McQuivey for the comparison that a minute of video is worth 1.8 million words. It is best read as an illustrative comparison about information density, not as a literal performance metric.
2. More Than 45% of Internet Users Watch Online Videos
An earlier benchmark cited by this article reported that more than 45% of internet users watched at least one online video per month. The same source reported an average exposure of 32.2 videos per month and 100 million daily online video viewers.
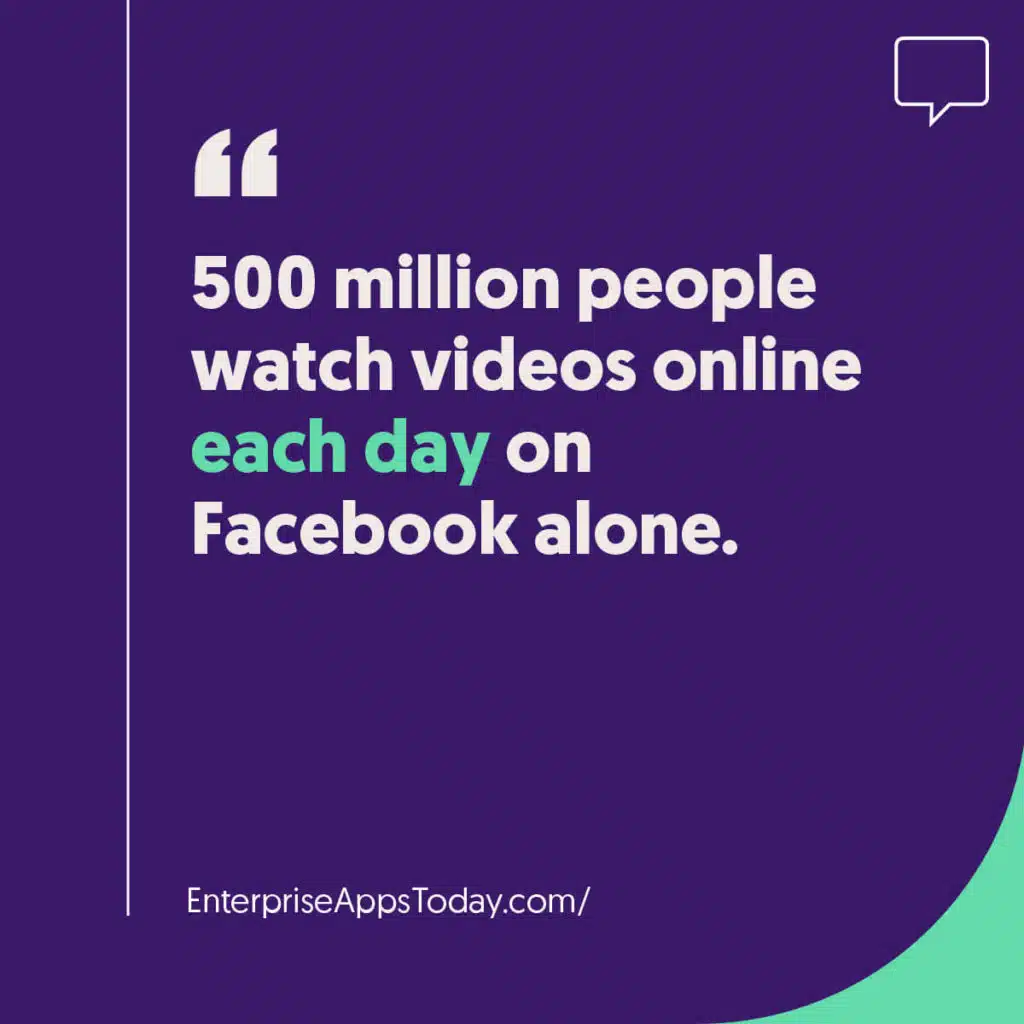
3. 500 Million People Watch Videos on Facebook
Enterprise Apps Today was the source cited in the original article for the benchmark that 500 million people watched Facebook videos each day. Treat this as a historical platform statistic and use current platform data when planning media in 2026.
4. Time Spent Watching Videos Has Increased
The legacy version of this article recorded 14 minutes and 6 seconds of YouTube viewing per day and said two thirds of viewers were still watching after 30 seconds. No traceable source was attached to this benchmark in the version we inherited, so the figures remain here for historical reference only.
5. The Average User Spends 16 Minutes and 49 Seconds Watching Online Video Ads
Siteefy was cited for the historical benchmark that the average user spent 16 minutes and 49 seconds watching online video ads each month. The number is useful as part of the page’s historical record, but current campaign planning should rely on platform specific analytics.
6. A Historical Forecast Put Video Viewing at 1 Million Videos Per Second
An older forecast cited by this page projected 1 million videos watched per second. Because the original wording referred to this year, I am preserving the number while labeling it clearly as a historical forecast.

7. Videos Helped 90% of Online Shoppers Make a Purchase Decision
The legacy article recorded two ecommerce benchmarks: 90% of online shoppers said product or service videos helped with a purchase decision, and 64% of consumers were more likely to buy after watching a product video. The original version did not attach a traceable source to this section, so both numbers remain as historical reference.
8. 65% of Video Viewers Clicked Through to a Website
Small Business Trends was cited for a group of older response benchmarks: 65% visited the vendor website, 50% looked for more information, and 45% contacted a vendor after an online video ad. The same source was cited for a business purchase benchmark of about 50%.
9. 84% of People Bought a Product After Watching a Brand Video
HubSpot was the source linked in the earlier article for the benchmark that 84% of people said a brand video convinced them to buy a product or service.

10. Real Estate Listings With Video Increased Inquiries by 403%
The original article cited Siteefy for the benchmark that real estate listings with video increased inquiries by 403%. This is a historical category specific figure, so real estate teams should compare it with their own listing analytics before using it as a forecast.
11. 75% of Executives Watched Work Related Videos Once a Week
The legacy article recorded that 75% of executives watched work related videos on business websites at least weekly. It also recorded that 50% watched business videos on YouTube and 65% visited a marketer website after viewing. No traceable source was attached to this section in the inherited copy, so the numbers are preserved as historical B2B benchmarks.
12. 59% of Senior Executives Preferred Video to Text
Small Business Trends was cited for the historical benchmark that 59% of senior executives preferred video when the same information was available in text.
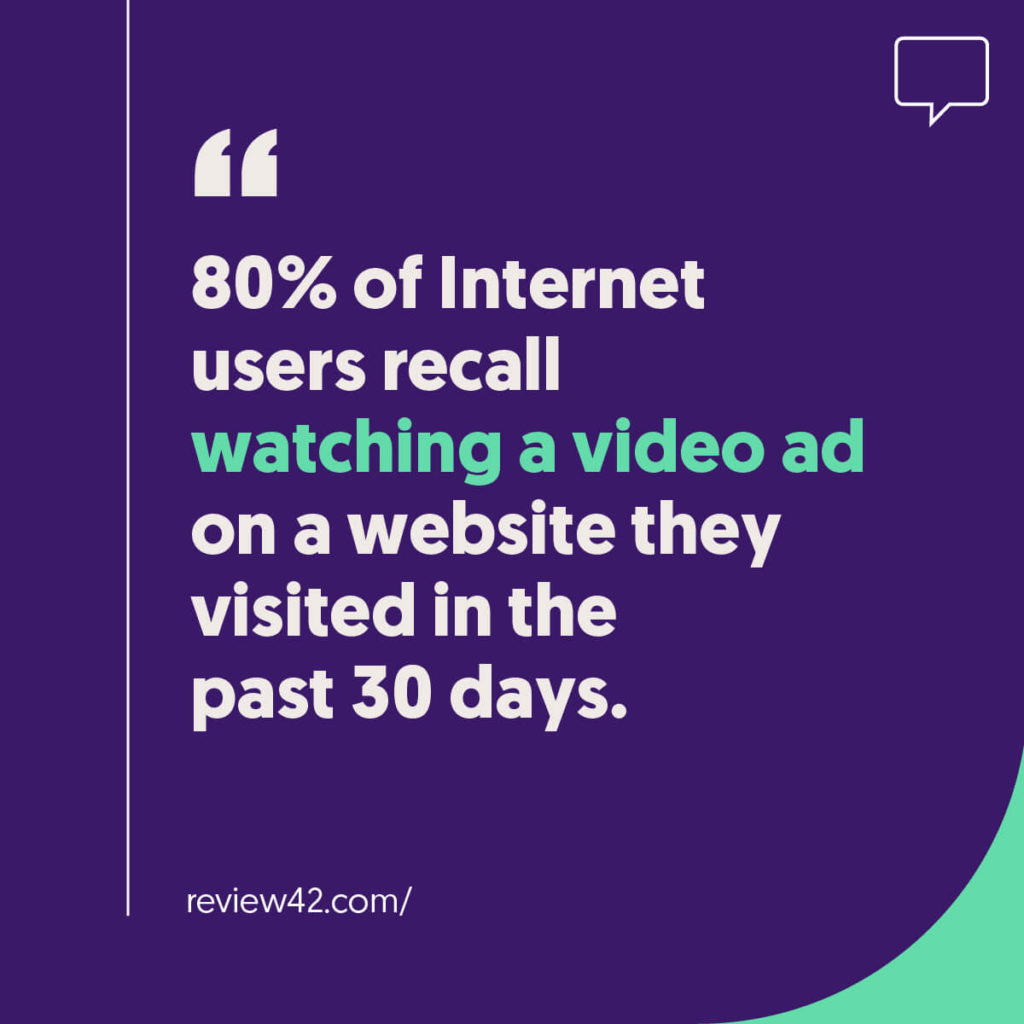
13. 80% of Internet Users Recalled a Video Ad
Review42 was cited for a historical advertising benchmark: 80% of internet users recalled a video ad seen on a website during the previous 30 days, and 46% of that group took an action afterward.
14. Website Visitors Spent 88% More Time on Pages With Video
Smart Insights was cited for the older benchmark that website visitors spent 88% more time on sites with video. For a current site, GA4 or another analytics platform can test whether video changes engaged time on the pages where you actually use it.
15. 64% of Website Visitors Were More Likely to Buy After Watching Video
The original article recorded that 64% of website visitors were more likely to buy from an online retailer after watching a video. It also recorded an average of two additional minutes on site among video viewers. Because no source was attached to this section, both figures remain as legacy ecommerce benchmarks.
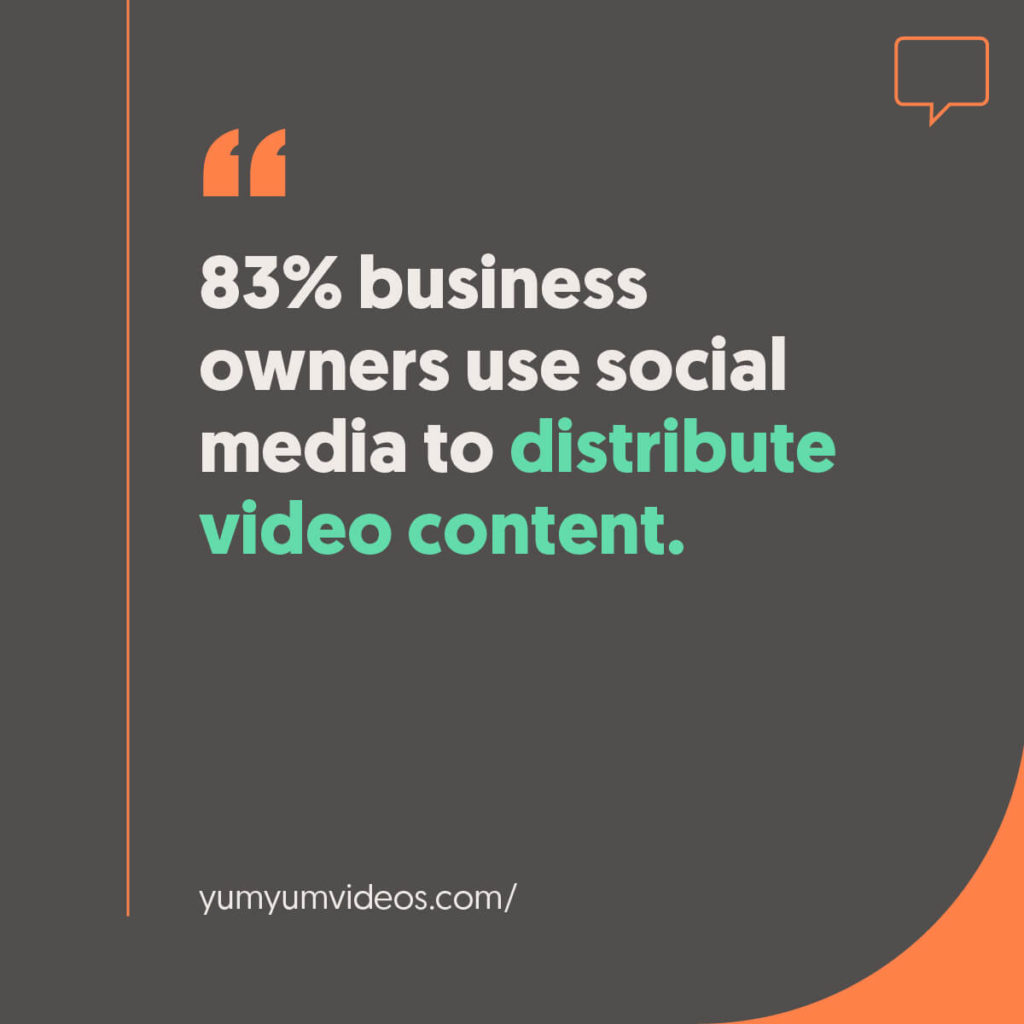
16. 83% of Business Owners Used Social Media to Distribute Video
An earlier Yum Yum Videos trends article was cited for the benchmark that 83% of surveyed business owners had used social platforms to distribute video marketing content. This is useful as a historical social media video statistic, especially when compared with current channel data.
Historical source. For an older platform specific benchmark, see our Instagram statistics.
17. Video in Email Improved Click Through Rate by 300%
Campaign Monitor was cited for the historical benchmark that adding video to an introductory email improved click through rate by 300%. Email clients and video support have changed substantially since this figure circulated, so test the format with your own list.
18. An Explainer Video Increased Conversion Rates by as Much as 144%
The original article cited Classy for a historical email benchmark of 200% to 300% higher click through rate when marketers included video. It also preserved a separate benchmark that an explainer video on a website could increase conversion by as much as 144%.
19. 51% Subscriber to Lead Conversion Increase With Video in Email
The legacy article recorded a 51% increase in subscriber to lead conversion when video was included in an email campaign. No traceable source was attached to this section in the inherited version, so the figure remains here as a historical benchmark.
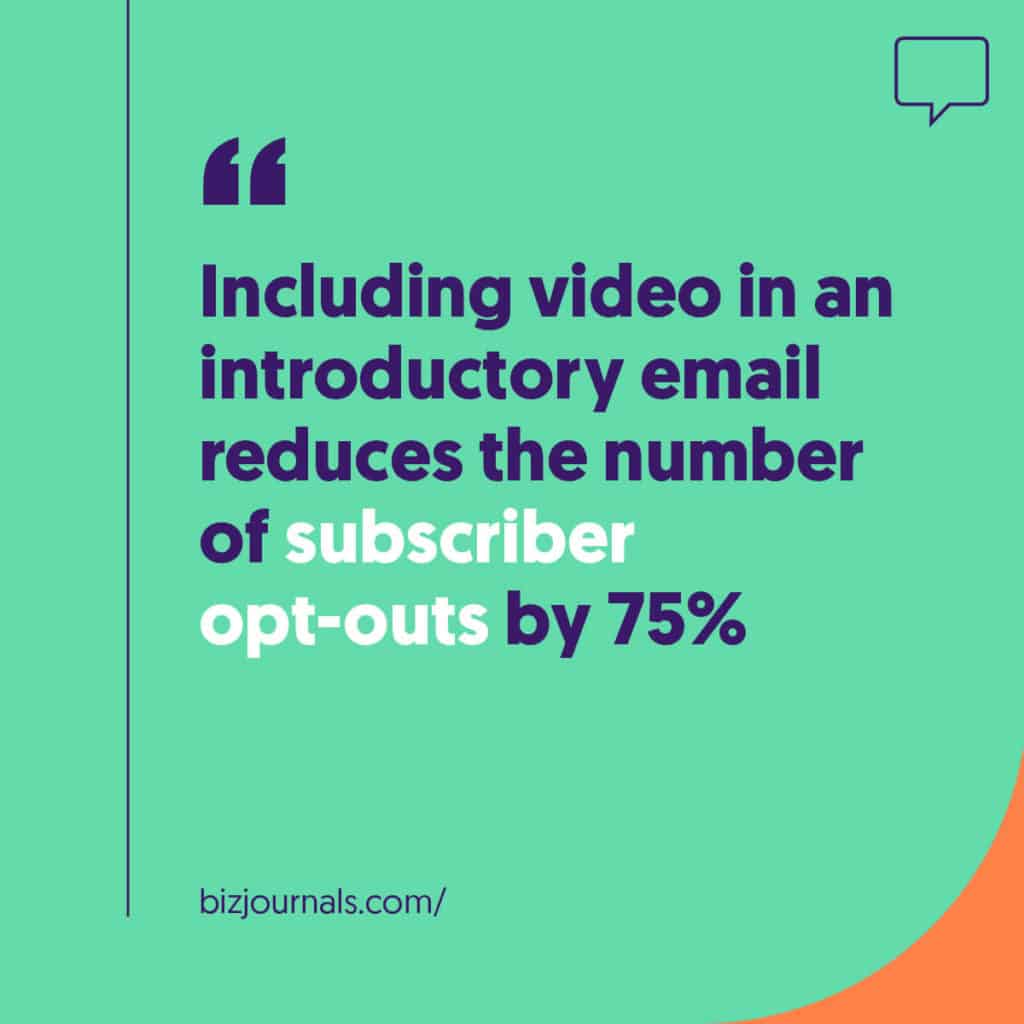
20. Video in Introductory Email Reduced Opt Outs by 75%
A Business Journals article was cited for the historical benchmark that video in an introductory email reduced subscriber opt outs by 75%.
21. The First 2.7 Seconds Were Cited as Key for Attention
Influencer Marketing Hub was cited for the benchmark that the first 2.7 seconds of a video were key to holding viewer attention. The exact threshold should be treated as historical, but the practical lesson is still measurable in your own retention graph: check where viewers leave during the opening.
22. 45% of Viewers Clicked Away by 1 Minute
The Tilt was cited for an older retention benchmark: 20% left within 10 seconds, 33% by 30 seconds, 45% by 1 minute, and almost 60% by 2 minutes. Current retention varies widely by subject, platform, traffic source, and runtime, so use this as historical context.
23. A Historical Benchmark Showed Longer Viewing on Mobile
Rocks Digital was cited for a device comparison in which desktop viewers stayed for two minutes or less, iPhone viewers averaged 2.4 minutes, Android viewers 3 minutes, and iPad viewers 5 minutes. Device behavior has changed since then, so current analytics should guide format decisions.
24. More Than 75% of Videos Were Played on Mobile Devices
TechJury was cited for the older benchmark that more than 75% of videos were played on mobile devices. The useful production lesson is to check mobile playback, captions, text size, and cropping on every platform where the asset will appear.
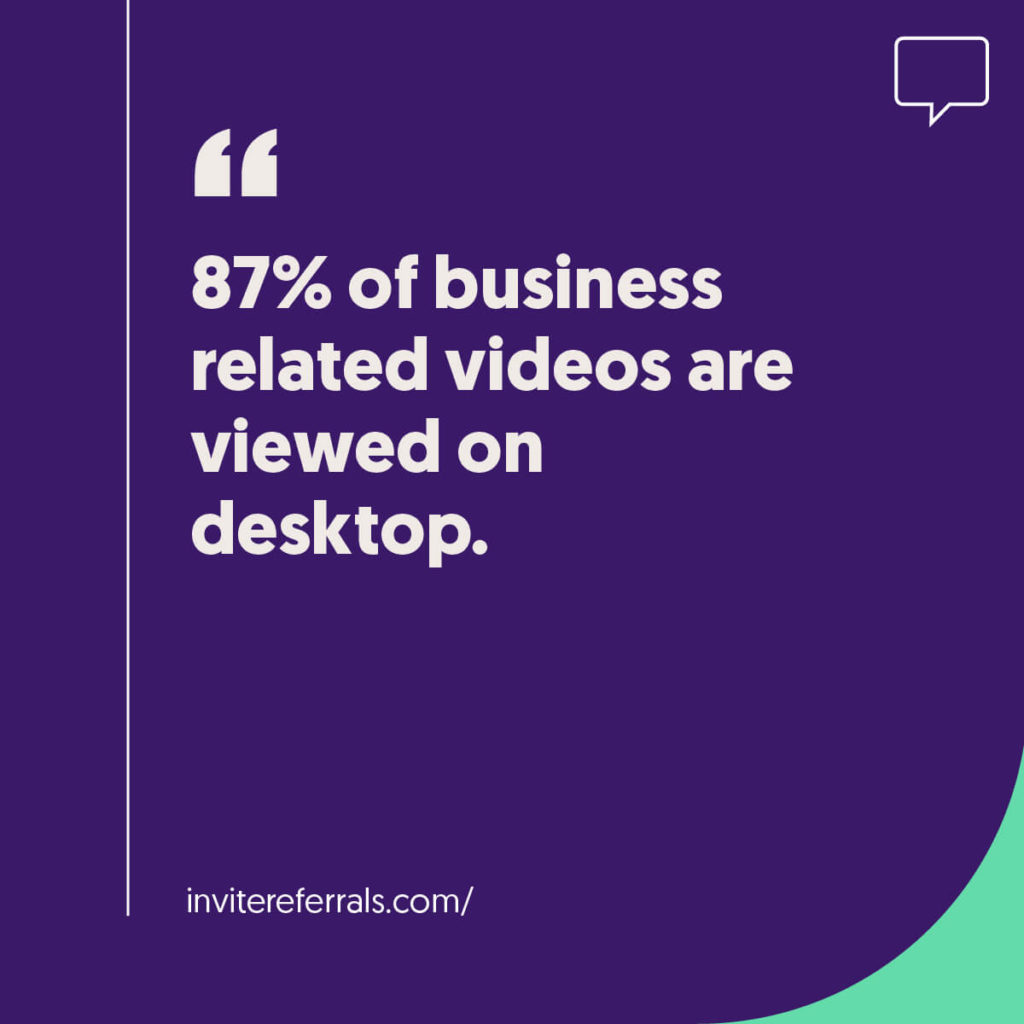
25. 87% of Business Related Videos Were Viewed on Desktop
InviteReferrals was cited for the historical benchmark that 87% of business related videos were viewed on desktop. This old B2B figure is worth keeping precisely because it contrasts with the much more fragmented device mix marketers plan for today.
26. Facebook Video Posts Generated 59% More Engagement
The original article referenced a Buffer and BuzzSumo analysis of more than 777 million Facebook posts and cited 59% higher average engagement for posts containing video. InviteReferrals was the linked source on this page.
27. 69% Preferred Short Videos to Learn About a Product or Service
Blogging Wizard was cited for the historical benchmark that 69% of people preferred short videos when learning about a product or service. For educational content, the same question applies today: how much information does the viewer need before the next action?
Historical source. For training specific benchmarks, see our eLearning video statistics.
28. 15 Second Videos Were More Likely to Be Shared
Siteefy was cited for the older claim that 15 second videos were more likely to be shared than 30 or 60 second videos. Treat the number as a historical social benchmark. Current sharing behavior depends heavily on platform, subject, and audience.
29. Mobile Users Watched Up to 90% of Vertical Video Ads
The legacy article recorded that mobile users watched up to 90% of vertical video ads compared with 14% of horizontal ads. No traceable source was attached to this section in the inherited copy, so the figure remains for historical comparison only.
30. 92% of Mobile Users Watched Video With Sound Off
OptinMonster was cited for the historical benchmark that 92% of mobile users watched video without sound and that 50% relied on captions to understand the content. The exact percentage is old, but captions remain useful for accessibility and silent viewing.
31. 50% of Manufacturers Improved Their YouTube Presence
The legacy article recorded that 50% of manufacturers improved their YouTube presence to build their brand and connect directly with consumers. The inherited section did not include a traceable source, so this remains a historical manufacturing benchmark.
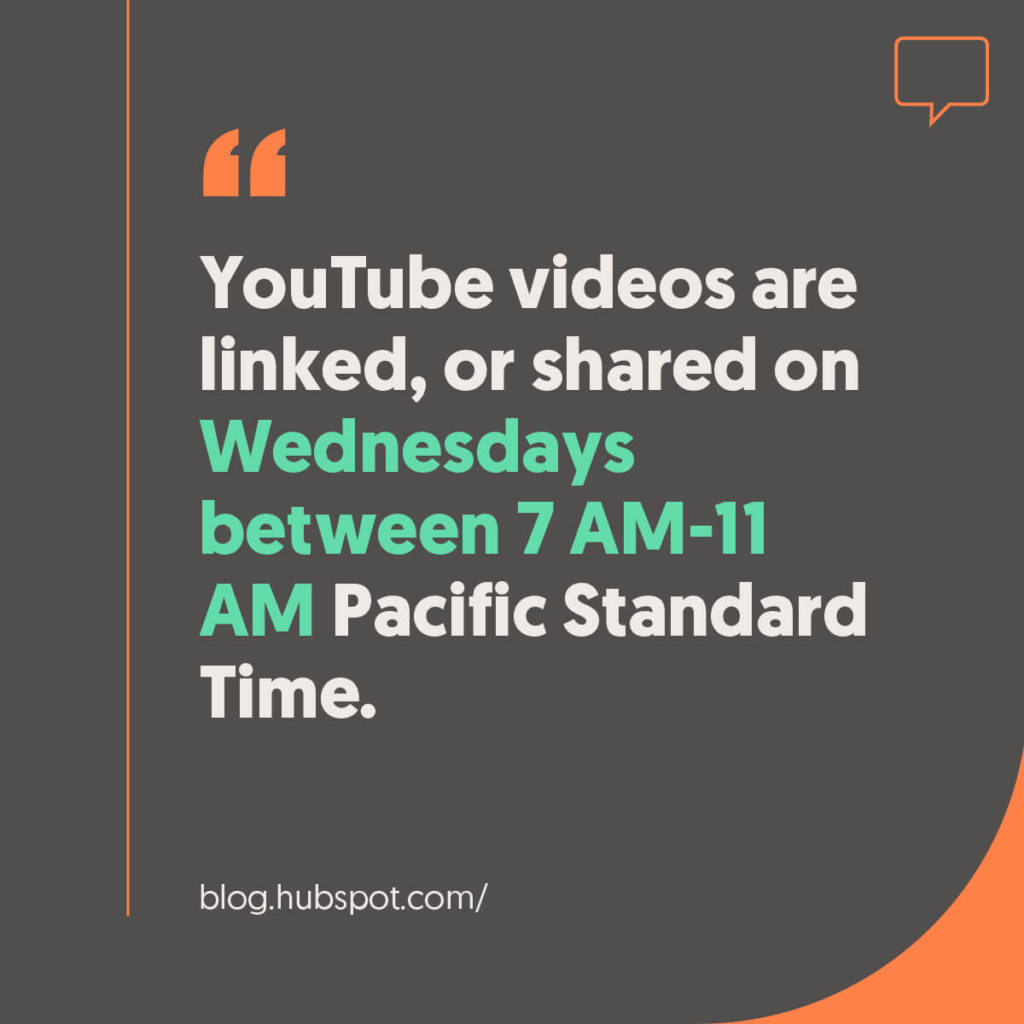
32. Wednesday Between 7 and 11 AM PST Was Cited as a Strong Sharing Window
An older HubSpot benchmark cited by this page associated Wednesday between 7 and 11 AM Pacific Time with popular video sharing and embedding activity. Publishing windows change with audience behavior, so current channel analytics should replace this benchmark for scheduling decisions.
How Effective Is Video Marketing?
No single industry percentage answers that question for every business. Video is effective when the metric tied to its job improves. A product demo should be judged against product page actions, trials, or sales conversations. A tutorial may be better measured through activation or support reduction. A campaign video may need reach, qualified traffic, or conversion.
That is why I would use the 2026 benchmarks for context and the 32 historical statistics for comparison, then make decisions from your own analytics.
Video Marketing Statistics FAQ
What are the most useful video marketing statistics in 2026?
Production cadence, platform use, viewing scale, AI adoption, and channel performance are useful when they come from current datasets. Wistia and YouTube provide several of the freshest benchmarks included at the top of this article.
What are B2B video marketing statistics useful for?
B2B video marketing statistics can help with channel planning and content format decisions. They should not replace your own CRM and sales data. A B2B video can have modest view volume and still be valuable if the right buyers watch it.
What are social media video statistics useful for?
Social media video statistics help compare platform scale, format adoption, and viewing behavior. For campaign decisions, combine them with your own retention, click, conversion, and audience data.
Should I still cite old video marketing statistics?
Yes, when the date and source are clear and the number is being used as historical evidence. Avoid presenting an old benchmark as current market behavior. That is why the legacy section above is labeled separately.
Are there separate whiteboard video statistics?
Reliable large scale datasets rarely isolate whiteboard animation as its own category. For whiteboard animation video performance, use the same metrics you would use for other educational video: retention, completion, comprehension, clicks, and the business action the video was built to support.
A Practical Way to Use These Benchmarks
- Use current 2026 data to understand the market and platform environment.
- Use historical statistics only when the date and source are clear.
- Compare both with your own video marketing analytics.
- Change the strategy only when the metric tied to the video’s job gives you a reason to change it.

Victor Blasco
Co-founder of Yum Yum Videos | Explainer Video & Video Marketing Expert
Victor Blasco has over 25 years of experience in animation and film production. For the past 14+ years, he has worked with companies to create explainer and marketing videos that simplify complex ideas and drive business results.
His work has supported global brands like Amazon and McKesson, as well as startups that raised over $2B and reached unicorn or IPO stages.
Victor shares insights based on real client work. His contributions have been published on platforms like Social Media Examiner, and he has been featured or quoted in outlets such as Forbes.